Gallery - Run Examples
To demonstrate the utility of the M1CR0B1AL1Z3R 2.0 web server, we present a detailed analysis of Chlamydia species
[A] M1CR0B1AL1Z3R 2.0 was used to analyze the genomes of 40 Chlamydia strains, and one Waddlia chondrophila which served as an outgroup (run A - 41 genomes in total, can download here). The run was conducted using the following parameters:
● Input FASTA files type: genomes (since the input Fasta files contain the full genomes of the strains, and not only ORFs)
● Minimum sequence identity (protein level) for homologs detection: 40.0
●Minimum sequence coverage (protein-level) for homologs detection: 70.0
●Minimum percent of strains required to consider an orthogroup as part of the core genome: 100.0
●Root the species tree according to this outgroup: Waddlia chondrophila WSU 86-1044
●Apply bootstrap over the species tree: True
●Filter out contigs/ORFs of plasmids: False
●Add orphan genes to orthogroups table: False
The results can be found here.
[B] To demonstrate the effect of optional parameters, a second analysis was performed, excluding Waddlia chondrophila as an outgroup (run B - 40 genomes in total, can download here). This run parameters were:
● Input FASTA files type: genomes
● Minimum sequence identity (protein-level) for homologs detection: 60.0
● Minimum sequence coverage (protein-level) for homologs detection: 80.0
● Minimum percent of strains required to consider an orthogroup as part of the core genome: 100.0
● Root the species tree according to this outgroup: No outgroup
● Apply bootstrap over the species tree: False
● Filter out contigs/orfs of plasmids: True (in this run we chose to remove records of plasmids from the input files before the analysis)
● Add orphan genes to orthogroups table: True
This analysis narrows the focus to relationships within Chlamydia species. We chose to increase the sequence identity and coverage thresholds for homologs detection, and thus we expect to get orthogroups that are more conserved with a smaller number of genes in each group. We also decided to explore strain-specific variations through orphan genes, hence we chose to include them as orthogroups (each contains a single gene) in the orthogroups table.
The results of run B are available here here.
Exploring the results
[1] Distribution of ORF count per genome
Results from run A demonstrates that most Chlamydia genomes have ORF counts clustered around 900:
This result is consistent with their relatively small genomes due to reductive evolution, where Chlamydia has lost enzymes and metabolic pathways for nutrients that are readily available from the host cell (Sigalova et al., 2019). The outgroup genome of Waddlia chondrophila deviates significantly, with ORF counts of ~1,900.
[2] Average Nucleotide Identity (ANI) analysis
The heatmap below represents the results of pairwise ANI comparisons of all genomes in run A:
 High ANI values (red) that are close to 100%, indicate strain pairs with high genetic similarity. The heatmap shows clusters of closely related strains or species within the same lineage (e.g., Chlamydia trachomatis strains clustering together). Intermediate ANI values (yellow/ light orange) in the range ~85–95% suggest moderate genetic divergence, potentially representing distinct, yet closely related species within the Chlamydia genus (e.g., Chlamydia psittaci and Chlamydia abortus). Low ANI values (green) below 85% denote significant divergence, highlighting strains more distantly related within the Chlamydia genus. This analysis provides insights into the phylogenetic relationships within the Chlamydia genus, supporting species classification and comparative genomic studies.
[3] Orthogroups
The orthogroup table contains for each orthogroup its member genes. The annotated version of the table contains three annotations: first, it shows the orthogroup size in terms of number of genomes and total number of genes, the second one is functional annotation based on the KEGG Orthology (KO) database, and the third is the mean Codon Adaptation Index (CAI) score of all ORFs in the orthogroup (Sharp et al., 1987).
Another output is the phyletic pattern - a presence/absence matrix of orthogroups across the genomes. The figure below shows the phyletic pattern of orthogroups from run A, which is enhanced with hierarchical clustering of the genomes:
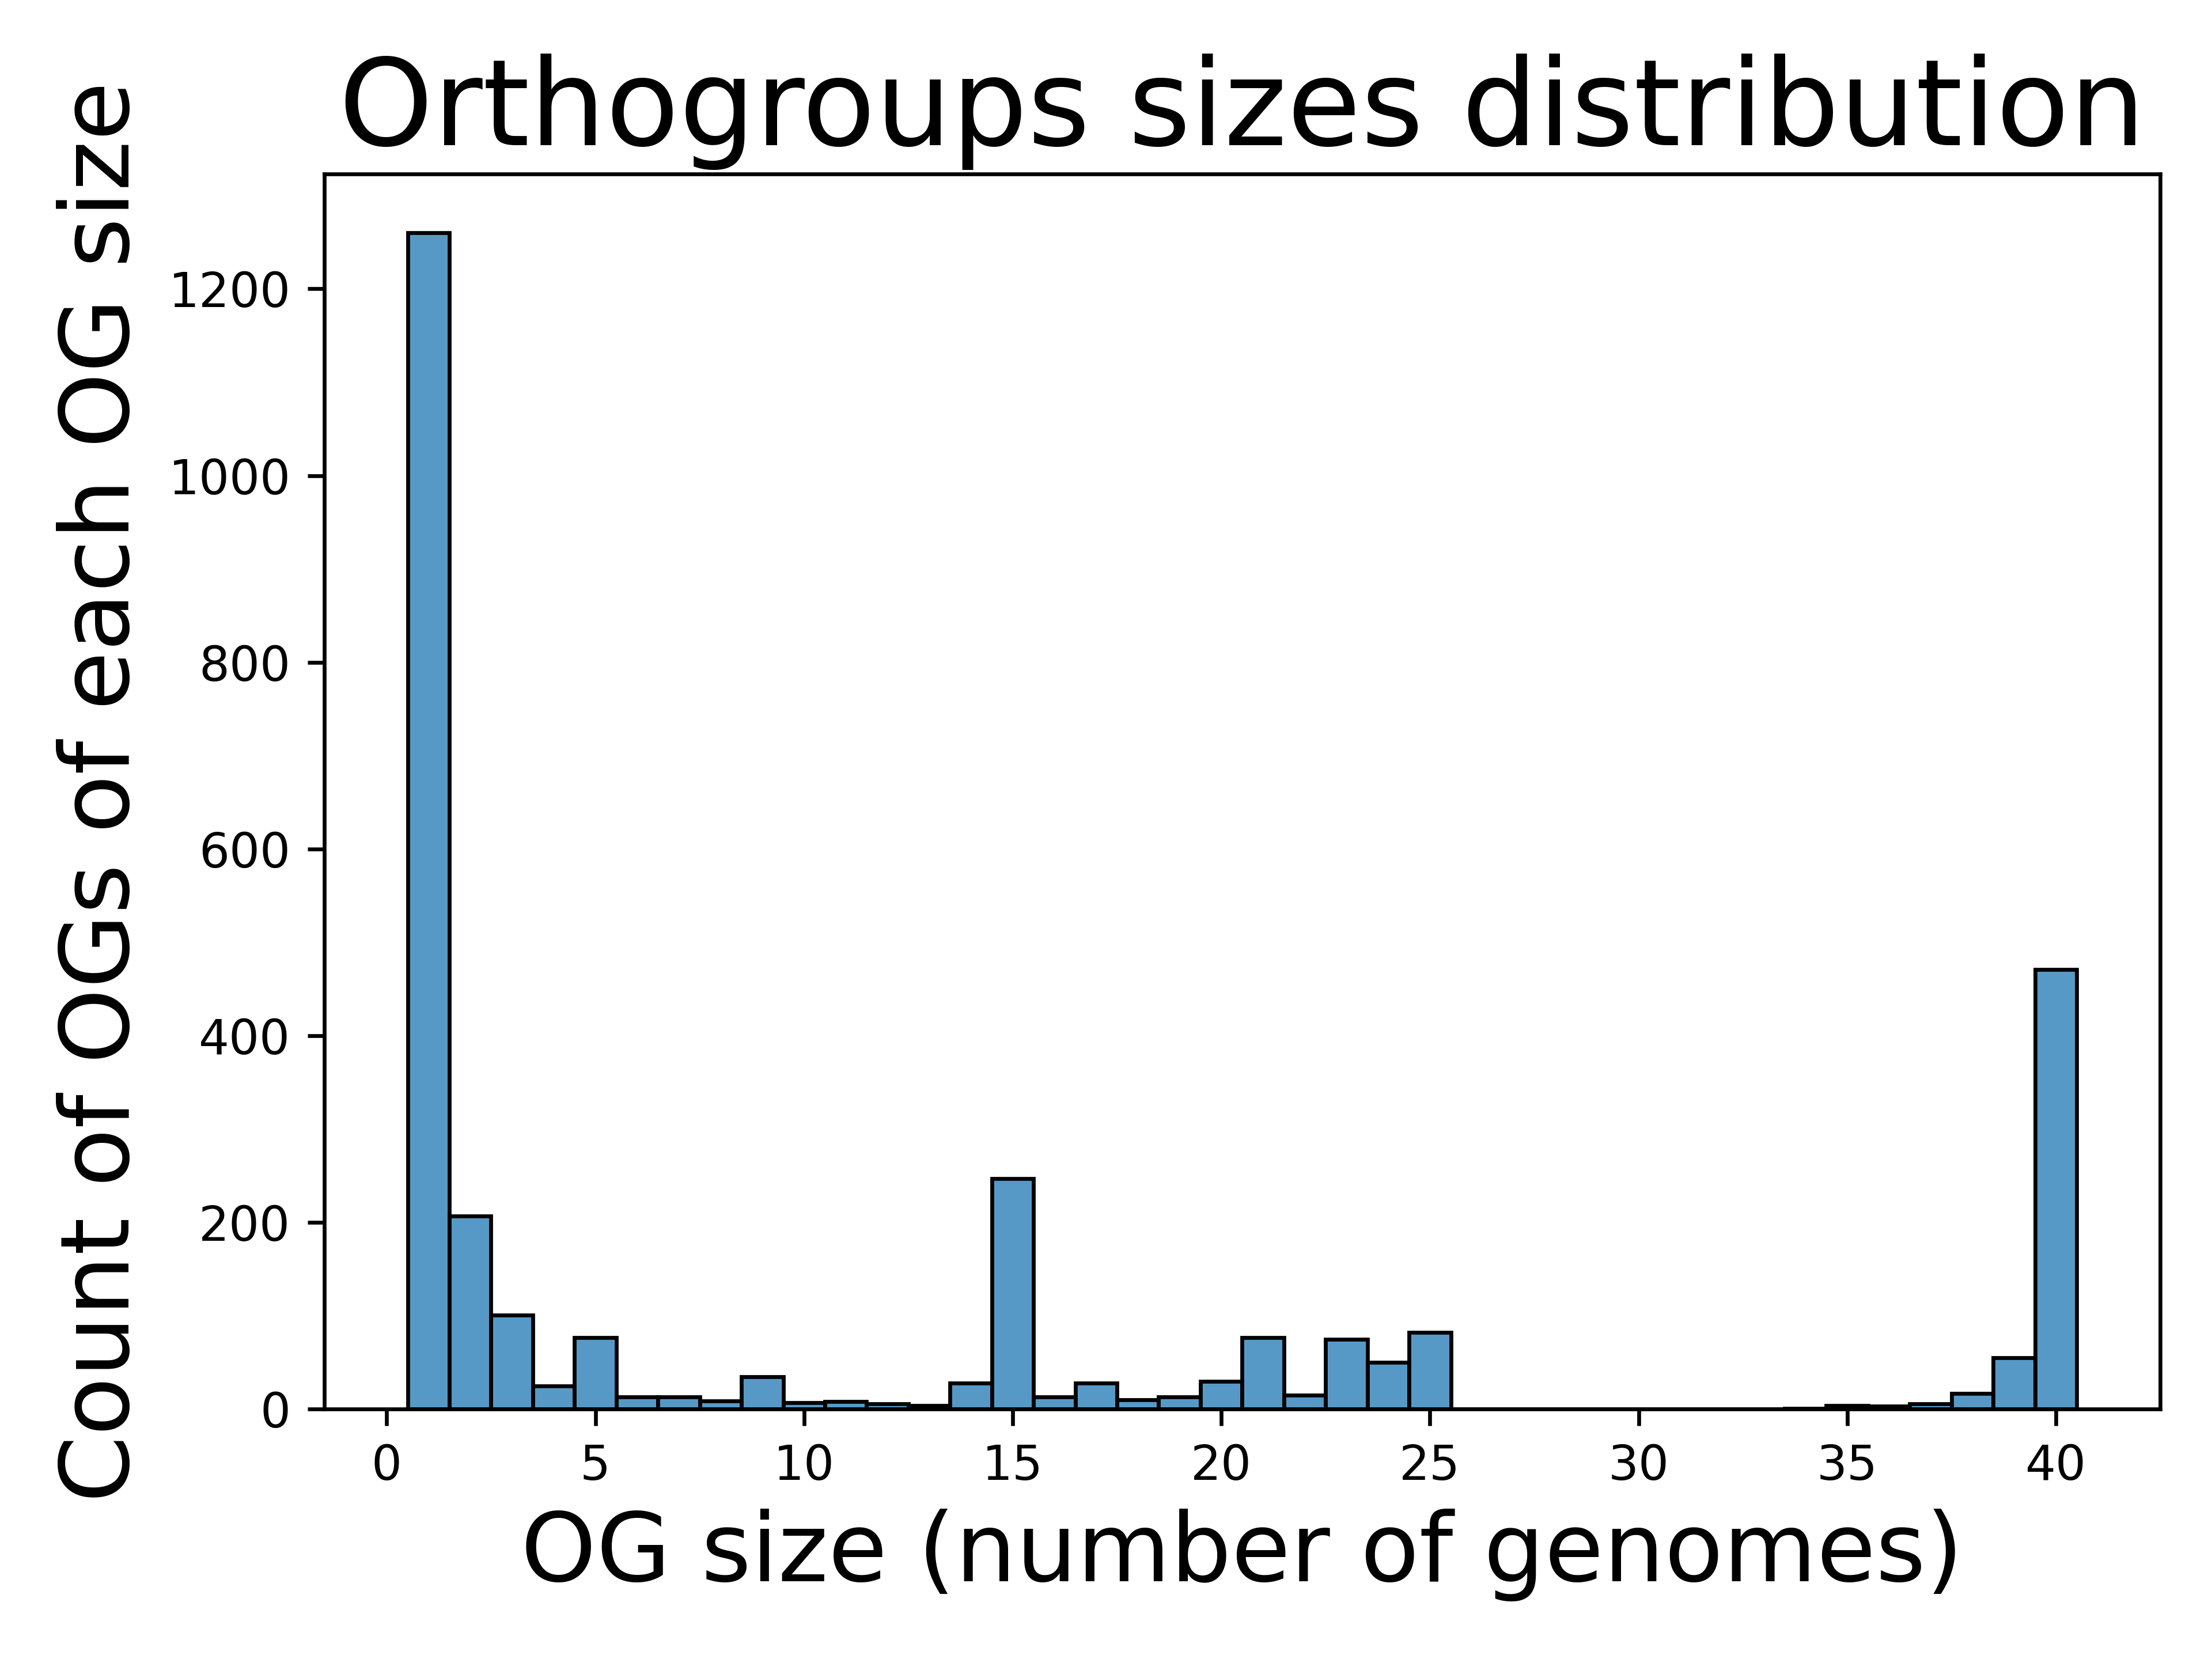
The histogram of orthogroups sizes from run A, derived from the orthogroups CSV file table, visually represents the distribution of orthology group sizes across the dataset.
The histogram reveals a conserved core genome within the Chlamydia genus, including the outgroup Waddlia chondrophila, with 384 core genes shared across all 41 analyzed genomes. This reflects the high gene conservation typical of closely related genomes. The intermediate distribution represents genes shared among subsets of genomes, suggesting conserved functions within specific lineages or species. Genes found in a few genomes likely indicate accessory genes or those acquired through horizontal gene transfer, potentially linked to niche-specific adaptations or environmental pressures on certain strains.
The orthogroups size distribution from run B shows a different pattern:
As expected, increasing the sequence identity and coverage thresholds for homologs detection produced smaller orthogroups. This occurs because fewer gene pairs meet the stricter similarity requirements. The high value of OG of size one stems from the fact that in run B we chose to include orphan genes as part of the orthogroups table (as indicates in run B parameters).
[4] Orphan genes analysis
The figure below from run A, shows the distribution of orphan gene counts across genomes, emphasizing genes that do not belong to any orthology group.
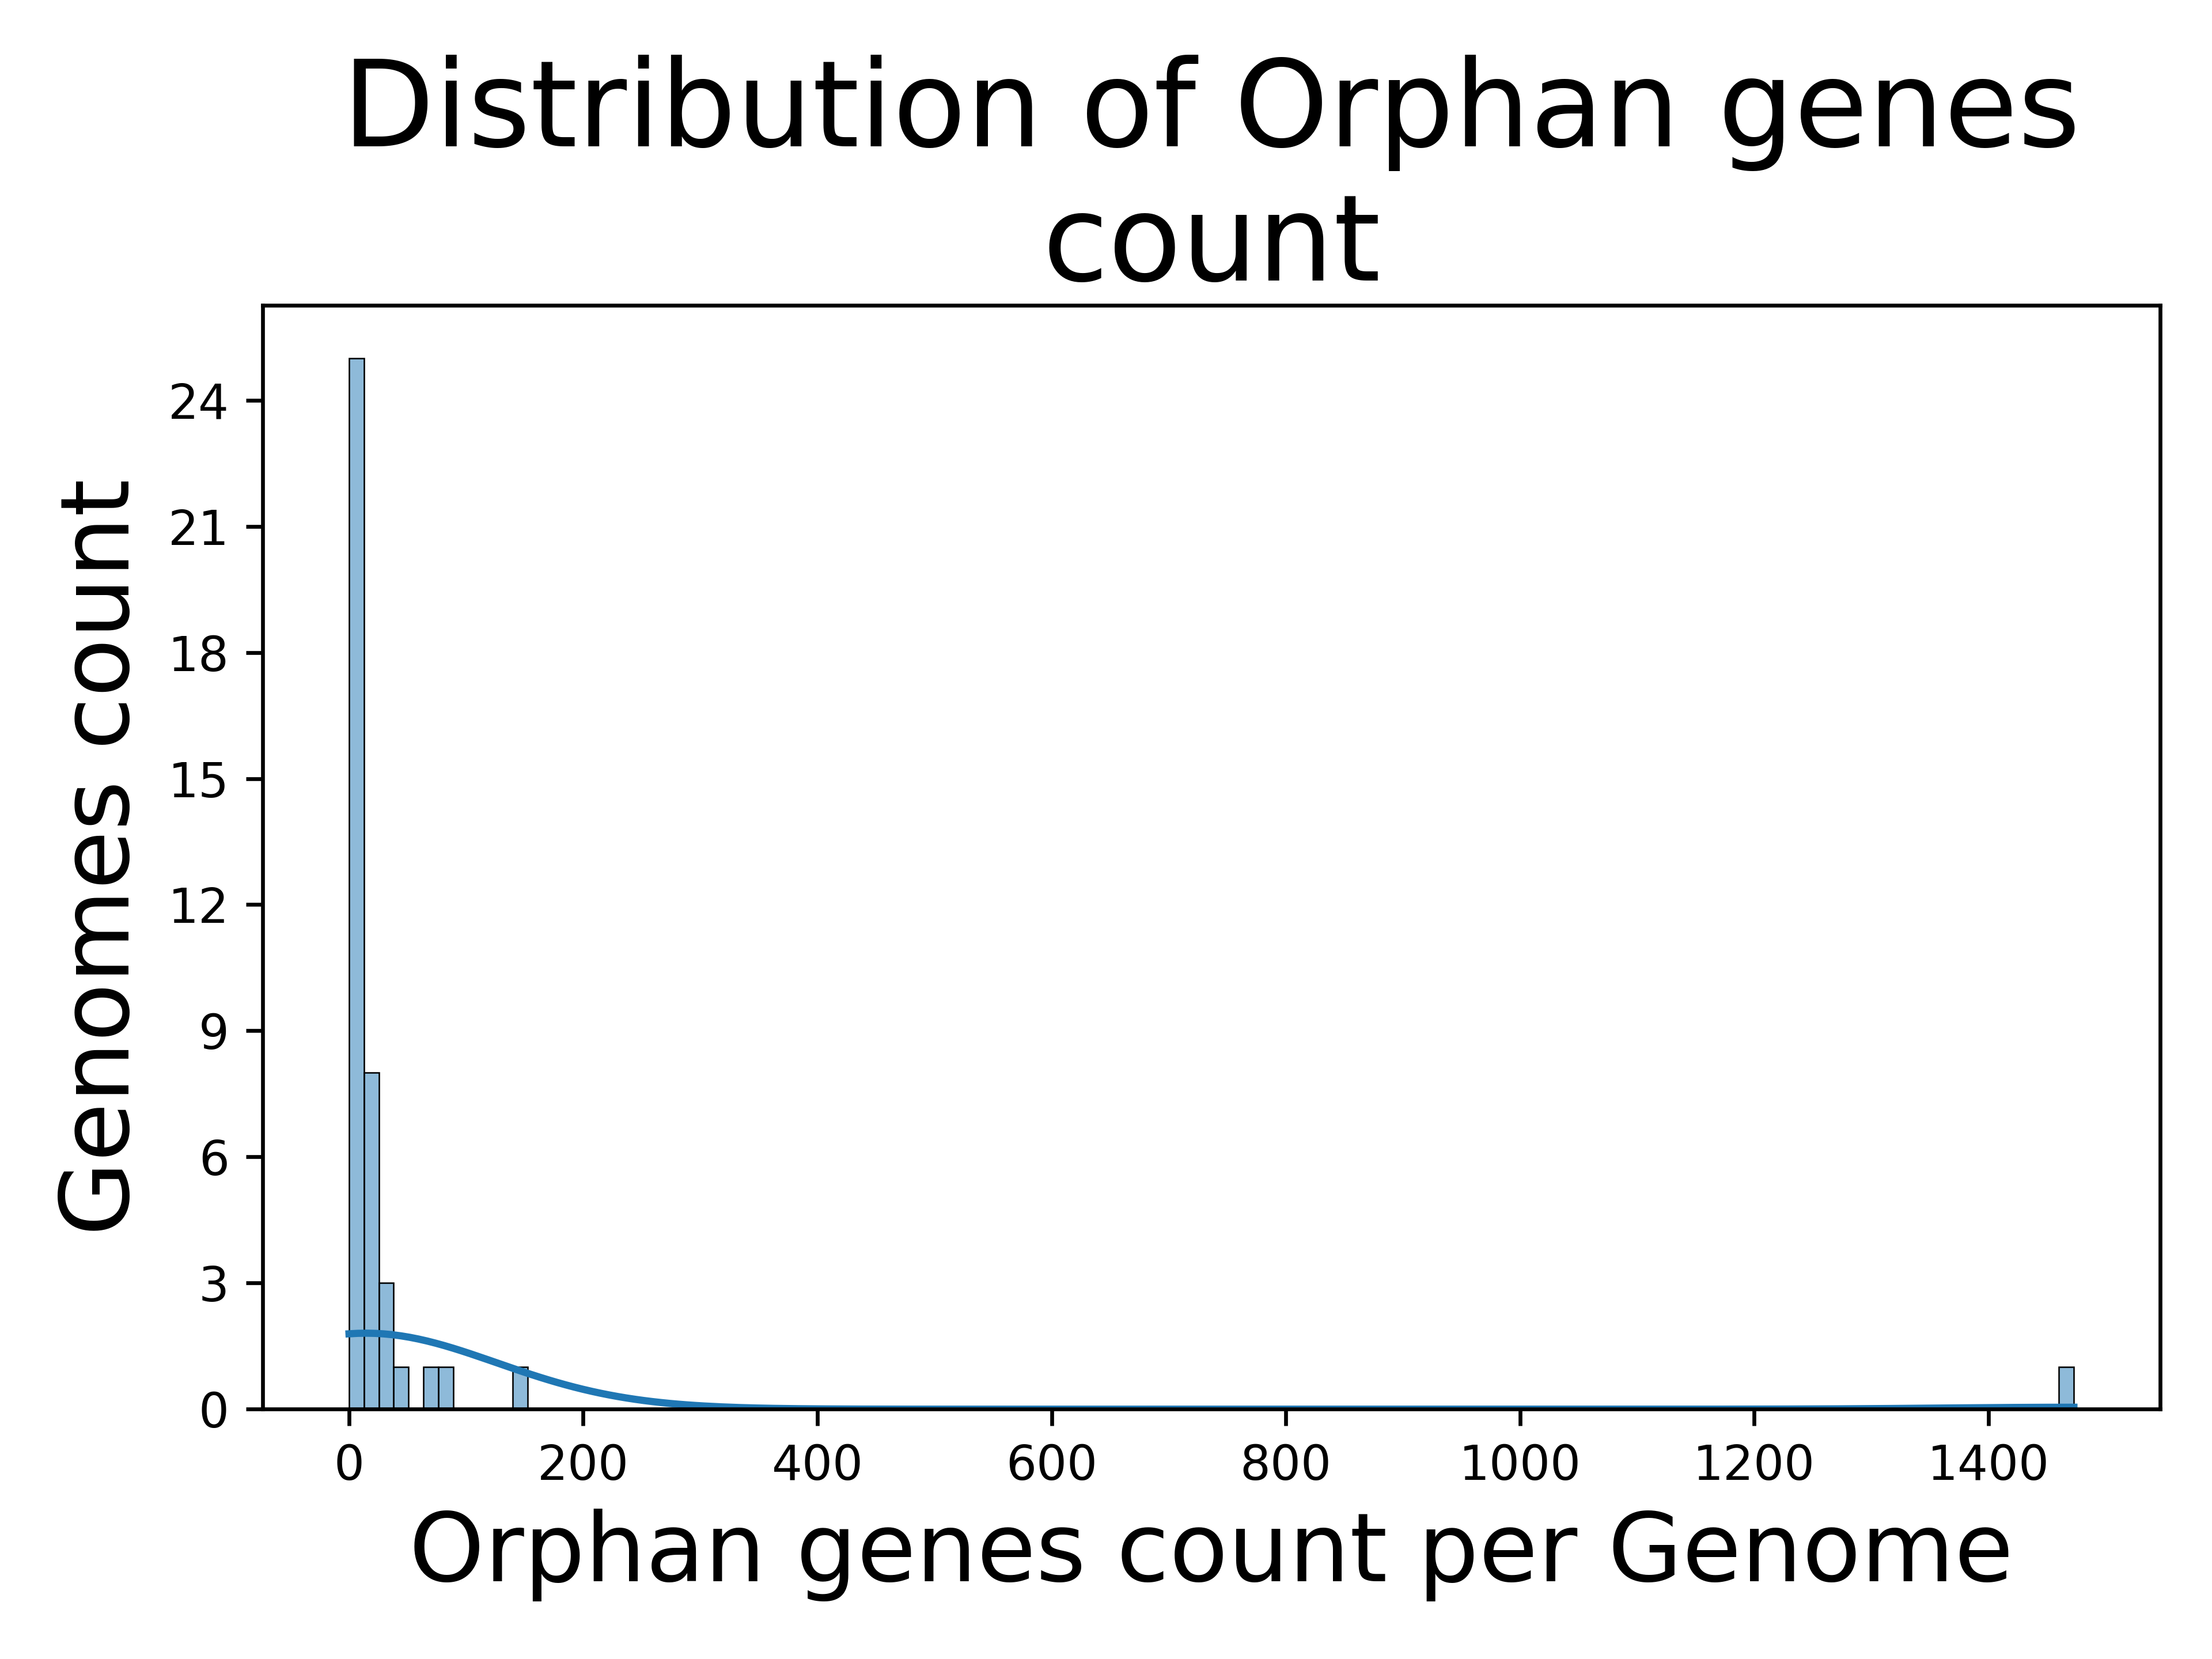
As reflected in the distribution, most genomes have a low orphan gene count, while a few show a higher count. The highest count (1,474 orphan genes) belongs to the outgroup, Waddlia chondrophila. The variability in counts among different Chlamydia species could signify differences in host specificity, pathogenicity, environmental adaptation, etc.
In run B, modifying the analysis parameters reveals noticeable differences:

Stricter criteria for homolog detection increase the likelihood of genes with moderate or low similarity to others to be classified as orphans, as they no longer meet the threshold to be grouped into orthology groups.
[5] Genome completeness
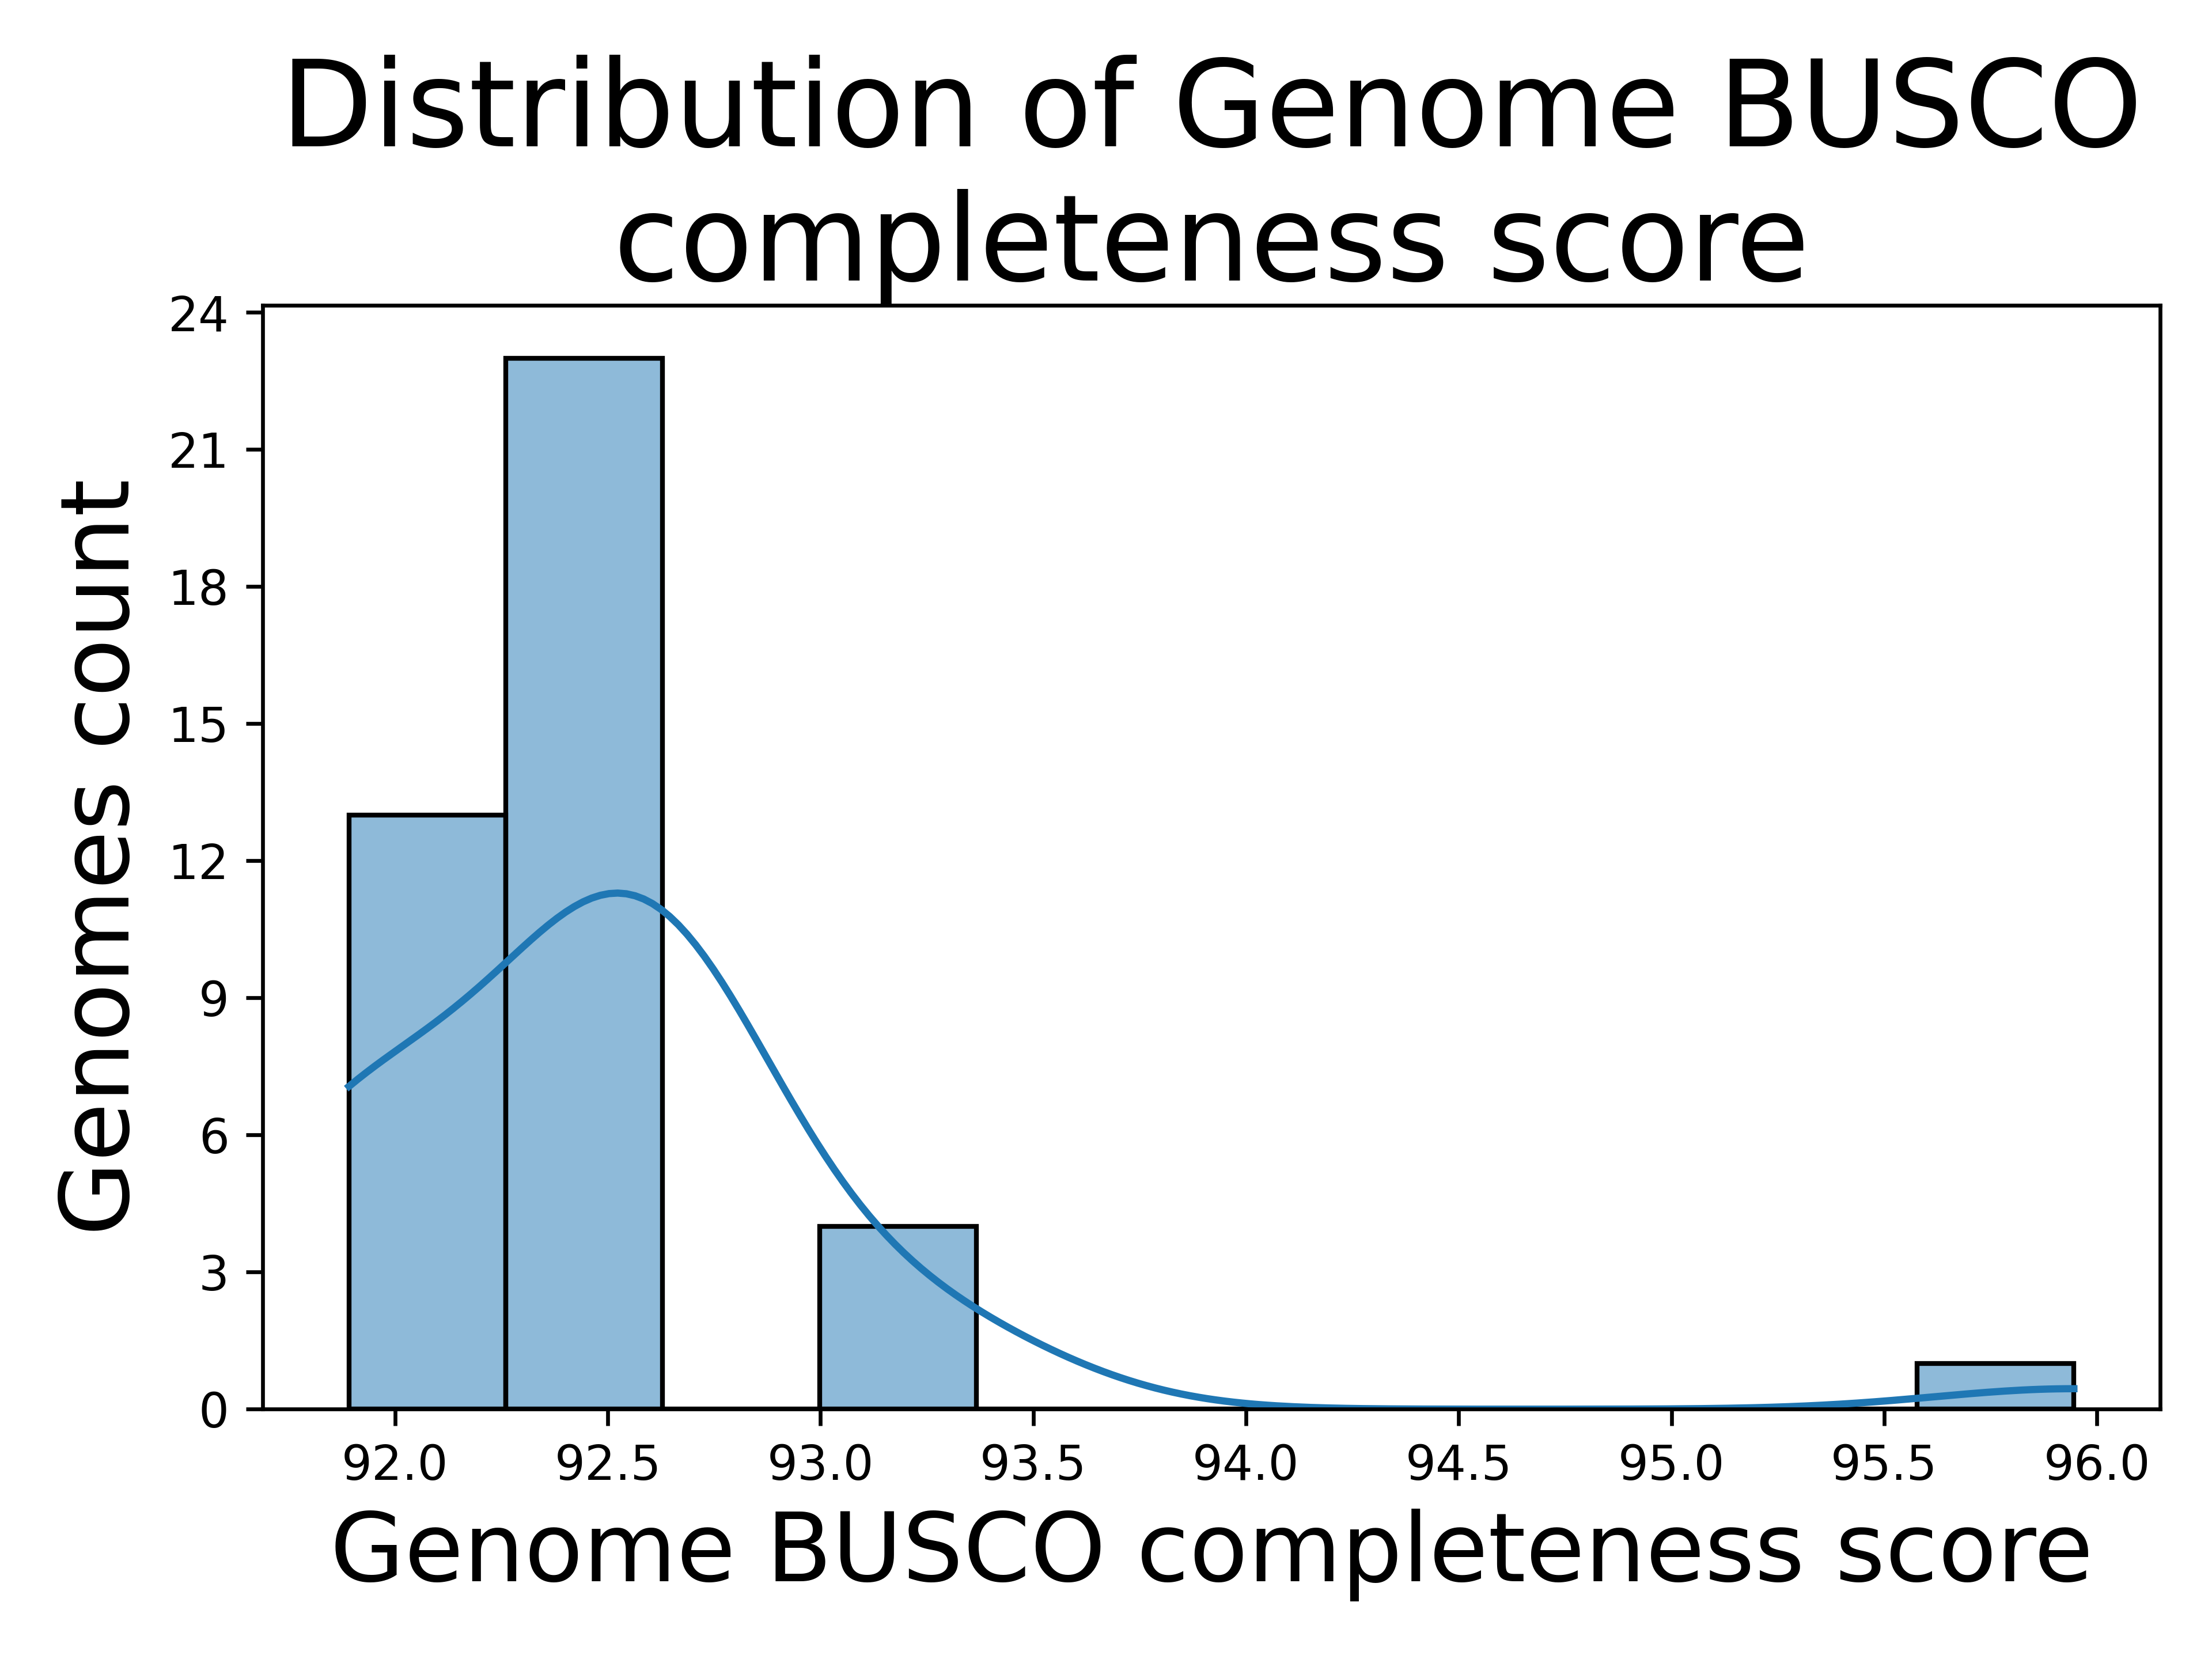
The distribution of Genome BUSCO completeness scores from run A suggests that most genomes analyzed are highly complete, with most scores clustered between 92.0 and 93.0. This indicates that the genomes are well-assembled and contain most of the expected single-copy orthologs, reflecting good quality and reliability for comparative analyses. The slight tail toward higher scores, up to 96.0, may represent a subset of exceptionally complete genomes, possibly due to higher sequencing or assembly quality. Overall, this distribution highlights the dataset's reliability for genomic studies while reflecting variability that may stem from sequencing depth, assembly techniques, or biological differences between the organisms.
[6] Genome numeric representation
This output helps to identify genome rearrangements such as insertions, deletions, inversions and translocations across different genomes.
In run A, the genome of Chlamydia abortus strain 162STDY5437294 was represented numerically as follows:
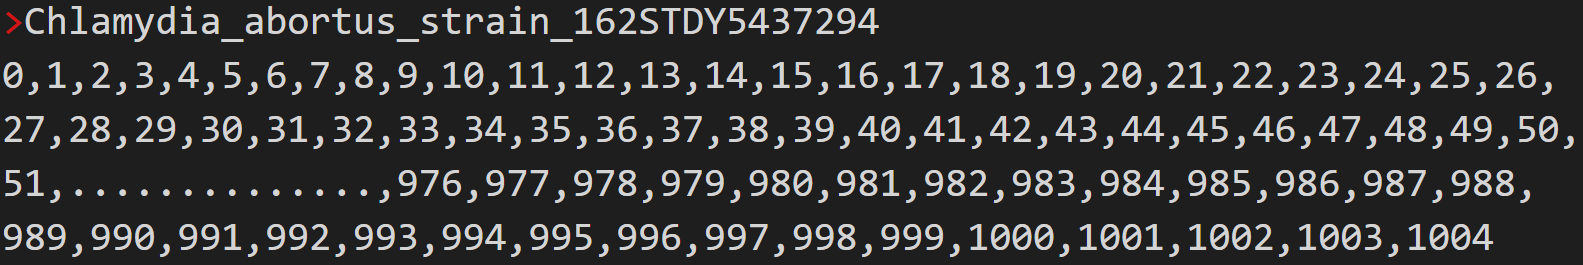
Each number represents the orthogroup number that contains the gene in the matching chromosomal location.
Below is an example of the genome numeric representation for Chlamydia trachomatis strain tet9a, highlighting genes insertion, inversion and translocation relative to Chlamydia abortus strain 162STDY5437294.
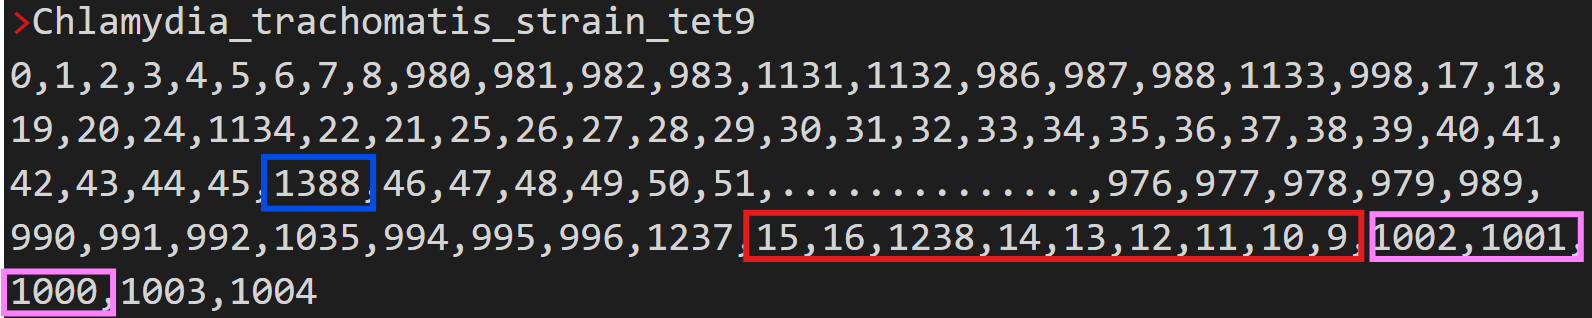
In this representation, the gene highlighted in blue represents an insertion, the segment highlighted in red was translocated relative to the genome of C. abortus strain 162STDY5437294, and the segment highlighted in pink was inverted.
[7] Phylogenetic tree
The phylogenetic species tree from run A (that included the outgroup and was rooted according to it) is as follows:

Excluding W. chondrophila, which served as an outgroup for rooting, the most divergent genomes in the tree are Chlamydia serpentis and Chlamydia pecorum, as indicated by the relatively long branches leading to these species. Consistent with their divergence from the main group of isolates, both species exhibit low ANI values in all pairwise comparisons, except when compared to themselves. Bootstrap values for each branch are highlighted in red.
Run B was conducted without a specified outgroup (in this case the tree is midpoint-rooted for the figure) and without bootstrap values:

This tree, constructed without an outgroup, focuses on internal relationships within Chlamydia species. Without an external taxon to define ancestral traits or lineage age, it highlights subtle genetic differences and close evolutionary connections within the group.